On this page
Explain Tab Reference
Purpose
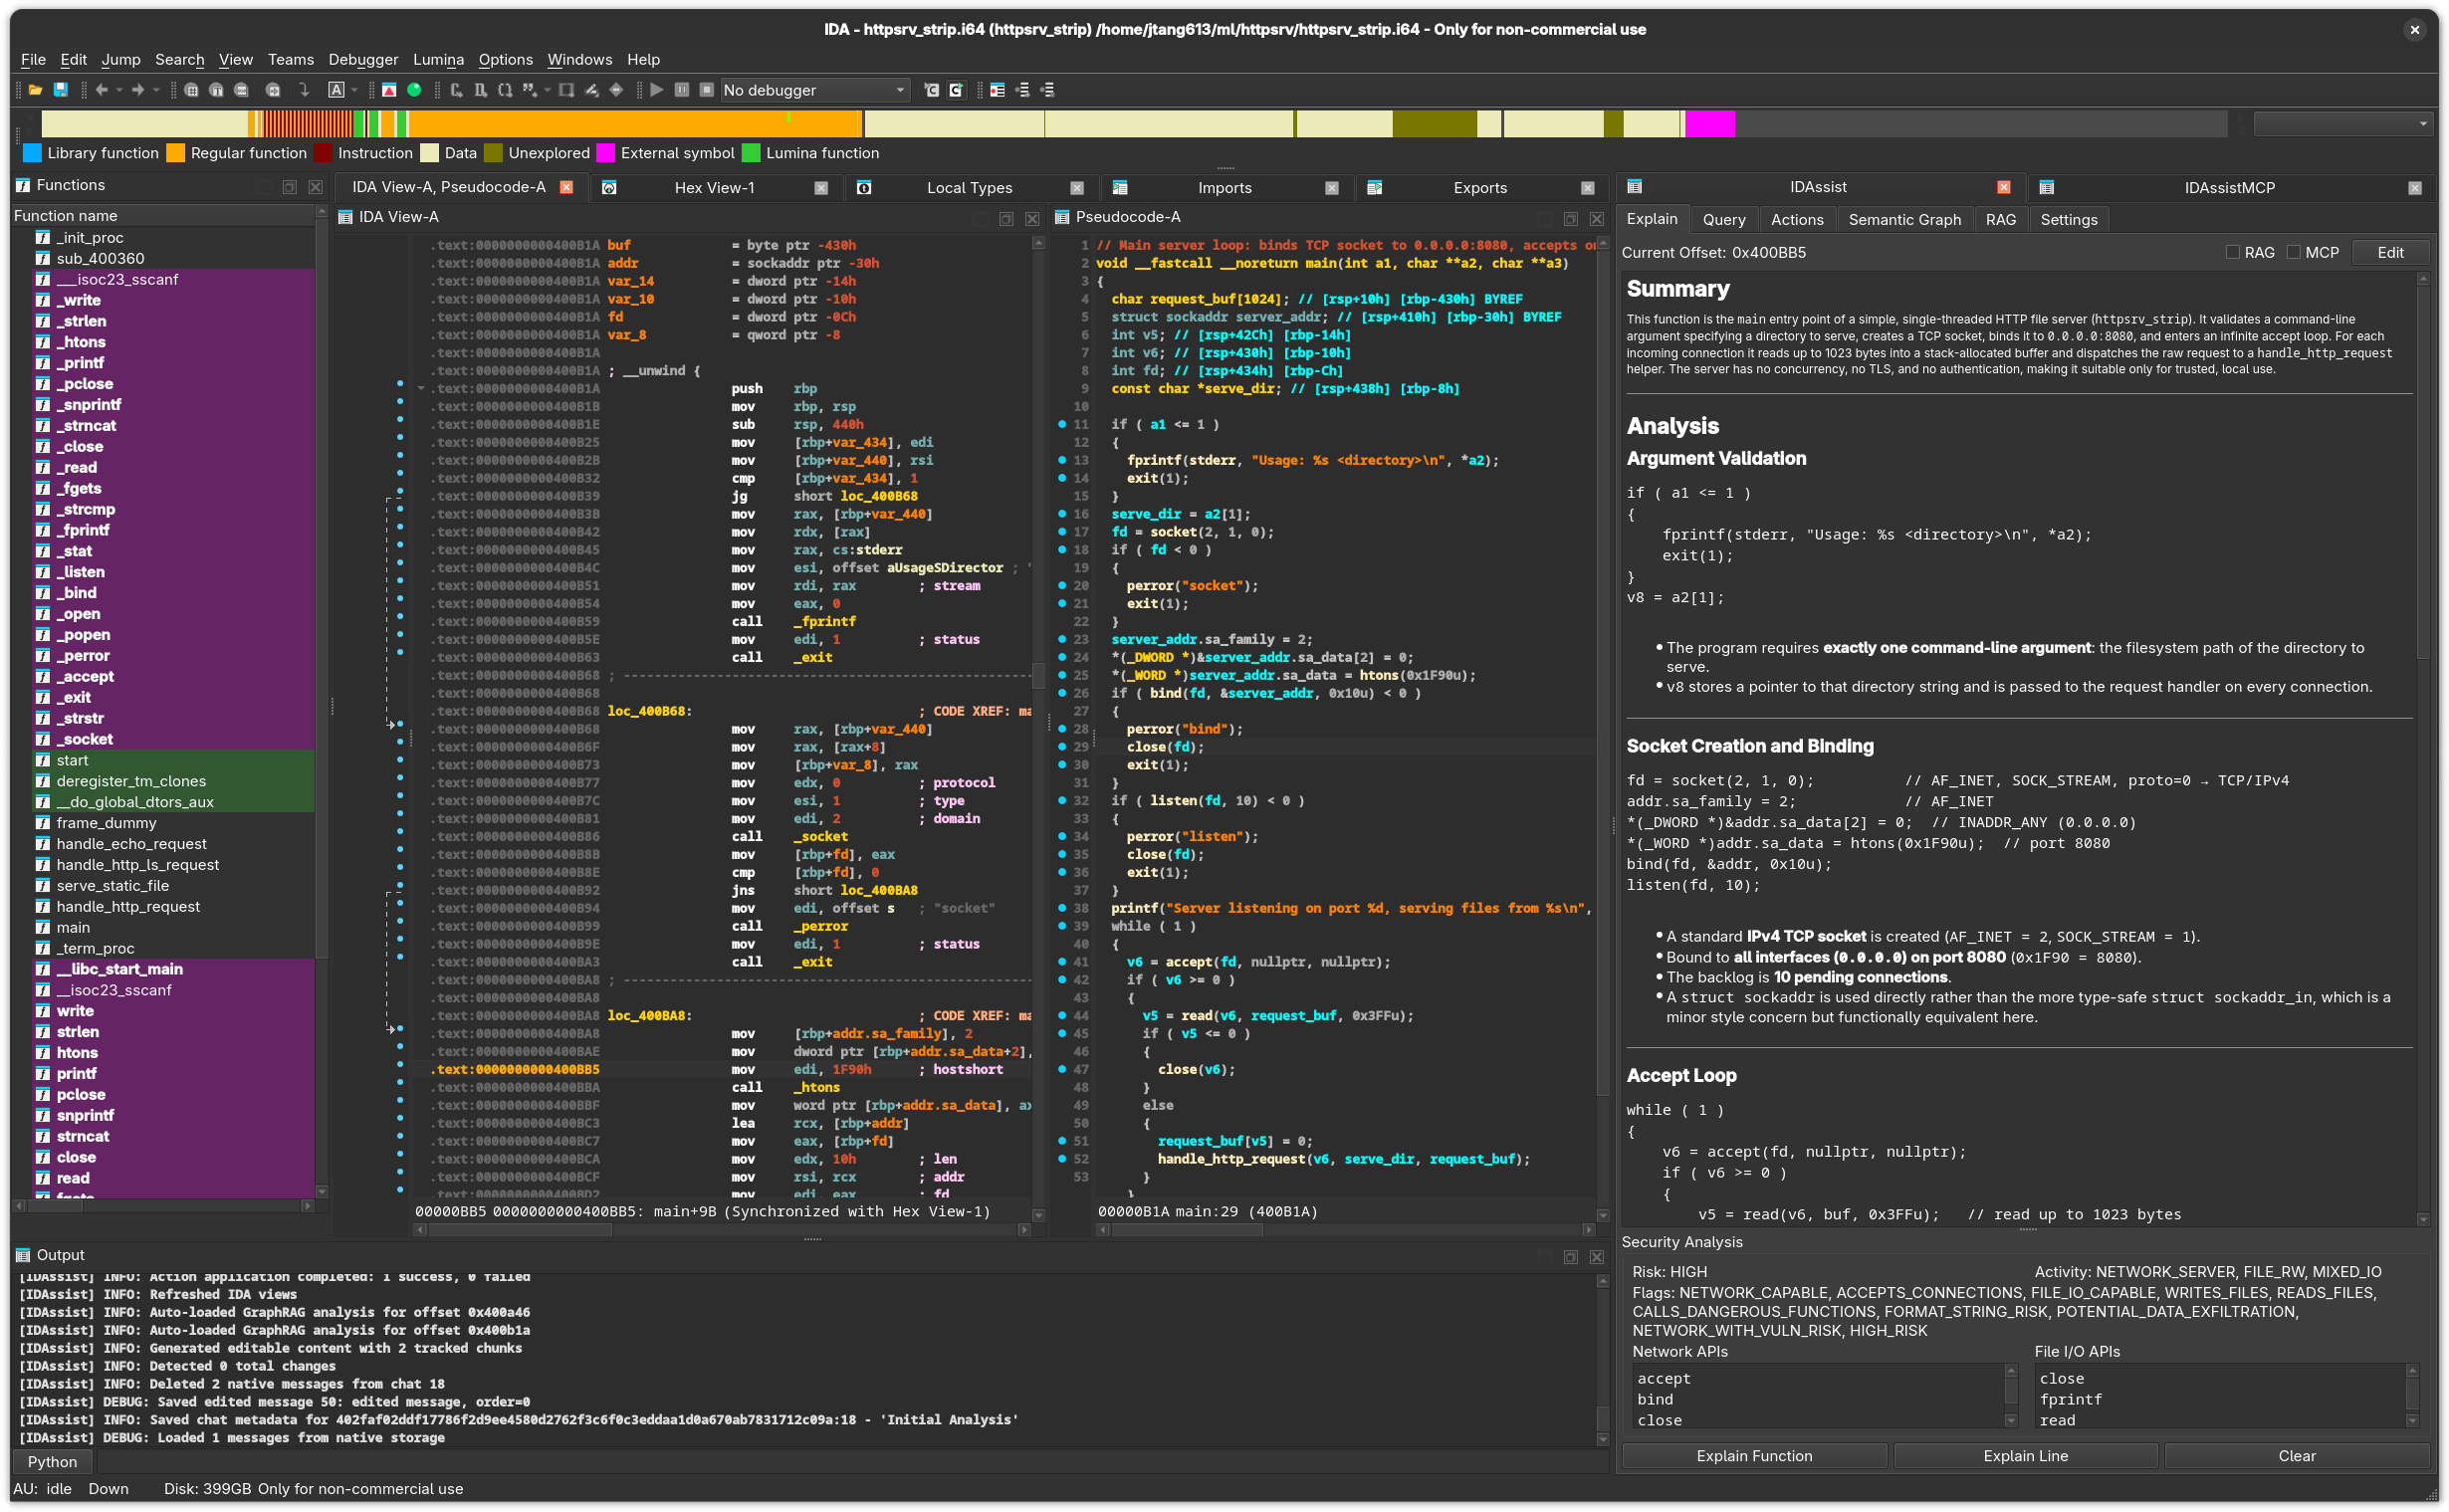
The Explain tab generates natural-language explanations of functions and individual lines using your configured LLM provider. It includes automatic security analysis with risk scoring, activity profiling, and API detection.
UI Elements
Top Row
| Element | Description |
|---|---|
| Current Offset | Displays the address of the function under the cursor. Updates automatically as you navigate in IDA. |
| RAG checkbox | When enabled, injects relevant RAG document snippets into the LLM prompt for context-enriched explanations. |
| MCP checkbox | When enabled, allows the LLM to invoke MCP tools during explanation generation. |
| Edit / Save button | Toggles between read mode (rendered markdown) and edit mode (raw text editor). |
Button Row
| Button | Description |
|---|---|
| Explain Function | Sends the current function’s pseudocode (or disassembly) to the LLM for explanation. |
| Explain Line | Sends only the current line for a focused explanation. |
| Clear | Removes the current explanation and security analysis from the display. |
During generation, the Explain Function and Explain Line buttons are replaced by Stop buttons to cancel the operation.
Display Area
The main content area uses a StreamingMarkdownBrowser that renders the LLM response as markdown in real time. Features:
- Incremental streaming — text appears as the LLM generates it
- Markdown rendering with code blocks, tables, and headers
- Ctrl+C copies the raw markdown source (not the rendered HTML)
- RLHF feedback links at the bottom of each explanation (thumbs up / thumbs down)
Security Analysis Panel
Appears below the explanation when security data is available. Displays:
| Field | Description |
|---|---|
| Risk Level | Overall risk assessment (e.g., HIGH, MEDIUM, LOW) |
| Activity Profile | What the function does (e.g., NETWORK, FILE_IO, CRYPTO) |
| Security Flags | Specific vulnerability indicators detected |
| Network APIs | Security-relevant network API calls found (socket, connect, send, recv, etc.) |
| File I/O APIs | File operation API calls found (open, read, write, unlink, chmod, etc.) |
The panel uses a two-column layout for the API lists.
Line Explanation Panel
When you click Explain Line, a secondary panel appears below the main explanation (40% height). It shows a focused explanation of the single line at the cursor. The panel has a close button (x) to dismiss it.
Edit Mode
Click Edit to switch from the rendered markdown view to a raw text editor. You can modify the explanation and click Save to store it. Edit mode is disabled during active LLM generation.
RLHF Feedback
At the bottom of each explanation, thumbs-up and thumbs-down links allow you to rate the quality. Feedback is stored in the RLHF database (~/.idapro/idassist/rlhf.db).
Function Context
The Explain tab tracks your cursor position in IDA via screen_ea_changed(). When you navigate to a different function:
- The Current Offset display updates
- If a stored explanation exists for that function, it loads automatically
- The security analysis panel updates to show stored data
Stored Explanations
Explanations are keyed by binary SHA-256 hash + function address and stored in the analysis database (~/.idapro/idassist/analysis.db). This means:
- Explanations persist across IDA sessions
- Each binary has its own set of explanations
- Previously explained functions load instantly without re-querying the LLM
IDA-Specific Details
- Pseudocode is extracted via
ida_hexrays.decompile()when Hex-Rays is available - Falls back to disassembly extraction when Hex-Rays is not available or decompilation fails
- Address tracking uses IDA’s
screen_ea_changedUI hook - All IDB reads happen on IDA’s main thread via
execute_on_main_thread()
Related Documentation
- Explain Workflow — Step-by-step guide for analyzing functions
- Query Tab — Ask follow-up questions about functions
- RAG Tab — Add reference documents for enriched explanations
- Settings Tab — Configure LLM providers and reasoning effort